Inside Angle
From 3M Health Information Systems

Increasingly disproportionate penalties in the Medicare Hospital Readmission Reduction Program (HRRP)
We have discussed payment adjustment for readmission measures in previous blogs. In those blogs, we focused upon risk-adjustment, preventability and the need to account for socioeconomic status (SES) when necessary (not always necessary for Medicaid, always for Medicare; but both require additional analysis). In this blog, we explore the payment penalties the federal government has implemented for one outcome: readmissions. Specifically, in this month’s blog, we are going to look at how performance differences between hospitals measured in the Hospital Readmission Reduction Program or HRRP are translated into penalties.
The HRRP establishes a prospective adjustment to the payments CMS makes to acute general hospitals paid under the inpatient prospective payment system (IPPS). The adjustment factor, computed annually, is based upon hospital performance in controlling readmissions over a three-year period. In calculating the adjustment factor, CMS compares the observed frequency of readmissions (subject to statistical modification) to an expected readmission rate. The final HRRP adjustment factor applied to IPPS payments is the sum of individual condition performance results (only a subset of all hospital conditions are considered in the HRRP) after applying a maximum penalty cap (currently 3 percent).
We have three major concerns with the way in which CMS has implemented the HRRP penalty:
- Positive performance on one readmission condition is not allowed to offset negative performance on another; only the sum of negative performance counts.
- The penalty calculation, while taking the number of excess readmissions as its basis, applies the result to the total number of admissions (not readmissions) within a condition when calculating the penalty. This has been termed the “multiplier effect” and has been detailed extensively elsewhere1.
- The penalty calculation is based upon the average cost of initial admissions (not readmissions). This means that the relative average cost of initial admissions within a condition raises or lowers the subsequent penalty without regard to the mix of all-cause readmissions that are the focus of the readmission reduction initiative.
Taken together these three elements mean that hospitals with better-than-average overall readmission performance can expect a very sizeable penalty on the basis of a single condition with a few excess readmissions. Moreover, the likelihood of this occurring will increase as: i) more conditions are added (two more are slated to be added in FY 2017) and ii) the proportionality between penalties and the cost of readmissions becomes more distant as readmission rates are reduced.
An approximation of the national relative readmit penalties is given in the table below:
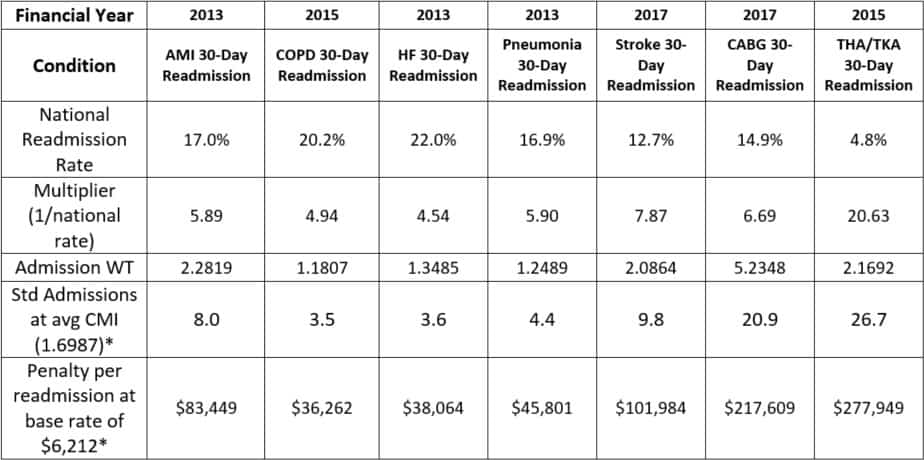
Table 1: National relative readmission penalty by condition (*CMS IPPS Final rule 2016)
Source: QualityNet and various CMS HRRP appendixes obtainable from the IPPS final rule home page
Table 1 demonstrates the relative contribution of a single excess readmission resulting from the CMS decision to apply the HRRP penalty (based upon excess readmissions) to the admission cost and volume.
The national readmission rate for each condition is given under the condition heading and the financial year in which the condition is added/to be added to the HRRP calculation. The mean admission weight (Admission WT) for the cases assigned to each condition is reported on row five and is obtained from the CMS Final Rule HRRP files. The multiplier – ratio of admissions to readmissions – is simply the inverse of the readmission rate which gives us the two statistics of interest in the bottom rows. In these rows we compute the penalty for a single excess readmission in terms of:
- Standard Admissions – using the average case weight of 1.6987 from the FY2016 IPPS Final rule
- Standard operating dollars – using the base rate of $6,212 from same
The outcome of the penalty math is that a single excess readmission for total hip arthroplasty (THA) and total knee arthroplasty (TKA) is going to generate a penalty of $278,000—about 27 times the payment for an average admission! This means that CMS is going far beyond recouping 100% of the cost of excess readmissions and moving into a wholly punitive stance in the pursuit of quality, particularly for conditions with the highest penalty multipliers. The three highest penalty multipliers—stroke, CABG and THA/TKA—have been added most recently, with two of those due to come into effect in FY2017.
The financial penalty is extremely out of proportion to the avoidable event. This, together with not allowing for performance across conditions to offset the rates, while adding new conditions has led to ever-increasing numbers of hospitals that will receive penalties. In FY2013, the year in which HRRP penalties were introduced, there was a maximum cap on the penalty of 1 percent. For that year, of the 3,500 hospitals at risk of penalty, 2,215 (63.3 percent) received a penalty and 12.6 percent of those had a penalty capped at the 1 percent maximum. In the FY2016 final rule, 76.9 percent (2,666) of hospitals received a penalty, of which 19.3 percent had a penalty of 1 percent or more. Both the number of hospitals penalized and the magnitude of penalties increased across the period independent of the increase in maximum penalty cap. It should be remembered that:
- According to MedPAC, efficient hospitals make margins on Medicare patients that are only slightly positive2, thus penalties for some service lines will contribute to significant losses; and
- These penalties have fallen disproportionately upon hospitals treating patients, and operating within areas, with low socioeconomic status3.
As importantly, of the 38 hospitals receiving the maximum 3 percent penalty in FY2016, 28 did so as a result of the Hip and Knee measure4, the disproportionate effect of which can be seen in Table 1. While one might assume that the increasing penalties resulted from large volumes of excess readmissions, this is not true. Instead, a mixture of only counting negative performance, while simultaneously adding measures, and the application of excess readmission rates to the cost and volume of initial admissions has resulted in an increase in penalties—a pattern likely to be further observed as high-cost conditions like CABG are thrown into the mix in FY2017.
The HRRP, however, is not alone in leveraging high penalties relative to modest variation in performance. Both the Hospital-Acquired Condition Reduction Program (HACRP)—more on this in an upcoming blog—and potentially, the Merit Based Incentive Payment System (MIPS), to be applied to physicians, takes a similar tack by leveraging a slice of measured performance with minimal difference into a potentially significant penalty or, in the case of MIPS, windfall gain. It is very possible that all these penalties in combination could exacerbate the already precarious state of safety net hospitals and put others at risk5.
We hope that blog readers will wish to strongly encourage CMS and legislators to rethink approaches that use such highly asymmetrical penalties.
Richard Fuller, MS, is an economist with 3M Clinical and Economic Research.
Norbert Goldfield, MD, is medical director for 3M Clinical and Economic Research.
1Medicare Payment Advisory Commission. Refining the Hospital Readmissions Reduction Program.; 2013. http://www.medpac.gov/documents/reports/jun13_ch04_appendix.pdf?sfvrsn=0.
2Medicare Payment Advisory Commission. Medicare Payment Policy : Chapter 3 Hospital Inpatient and Outpatient Services.; 2015. http://www.medpac.gov/documents/reports/mar2015_entirereport_revised.pdf?sfvrsn=0.
3Atkinson JG. Flaws in the Medicare readmission penalty. N Engl J Med. 2012;367(21):2056-2057. doi:10.1056/NEJMc1212281.
4Centers for Medicare & Medicaid Services. FY2016 Hospital readmission reduction program supplemental data file (Final rule and correction notice). Details for title: FY 2016 Final Rule and Correction Notice Data Files. https://www.cms.gov/Medicare/Medicare-Fee-for-Service-Payment/AcuteInpatientPPS/FY2016-IPPS-Final-Rule-Home-Page-Items/FY2016-IPPS-Final-Rule-Data-Files.html?DLPage=1&DLEntries=10&DLSort=0&DLSortDir=ascending. Published 2015.
5Kahn CN, Ault T, Potetz L, Walke T, Chambers JH, Burch S. Assessing Medicare’s Hospital Pay-For-Performance Programs And Whether They Are Achieving Their Goals. Health Aff. 2015;34(8):1281-1288. doi:10.1377/hlthaff.2015.0158.


Richard Fuller, MS
Economist, Clinical & Economic Research
Rich Fuller, MS, is the manager of data analysis and economics for the Clinical and Economic Research Group at 3M Health Information Systems. At 3M he works within clinical teams…
Recent posts


Norbert Goldfield, MD
Medical Director, Clinical and Economic Research
Norbert Goldfield, MD, is medical director for 3M Health Information Systems. For over 20 years he has been responsible for implementing national and international payment systems linked to quality, with…