Inside Angle
From 3M Health Information Systems

Connecting the pieces of the CAC puzzle
Have you ever spent time putting together a puzzle only to find out you are missing one or two essential pieces? Few things are more frustrating than an almost masterpiece in any art. Over the past several months, we have talked a lot about how to measure a CAC system in multiple blogs. Precision and Recall were discussed in “About Accuracy…” coding acceptance methods were discussed in “Coder Acceptance Data: Am I using the correct coding methods?” Minutes per chart were examined in “How are my numbers? Analyzing your CAC data.”
Today I want to walk you through how to apply these concepts in unison. In a sense, we are going to go over our puzzle and try to avoid any frantic searching of the living room floor to find missing pieces. Let’s make sure we have all the pieces and understand where they all go.
To do this, we’re going to look at some data and do a little role playing. Suppose you walk into work Monday morning and open up your CAC system reports because you want to see how your coders did last week. You see the following table:
Hospital XYZ
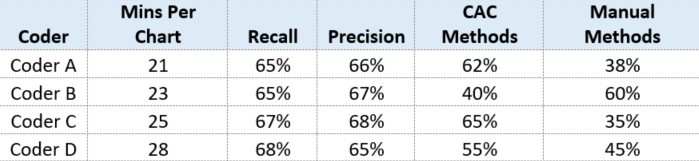
Now Hospital XYZ has more than four coders, but you want to first focus on these four because you have some time scheduled with these coders today. Starting with Coder A, you see that the minutes per chart is lower than the average for the hospital, and this coder’s use of CAC Methods is pretty high. It is close to what recall is so that tells you that Coder A is using a lot of help from the engine. Coder B has a little higher minutes per chart than coder A, but still lower than the average for the hospital. This coder’s CAC methods, however, are quite a bit lower than recall for the records he/she coded last week. This means that Coder B could increase use of CAC methods by 25 percent (Recall – CAC Methods = Opportunity for Increased Use of CAC). Next, you look at Coder C and notice that the minutes per chart is higher than the average for the hospital and CAC methods are pretty close to recall – this surprises you, so you make a note to look a little deeper into Coder C’s data. Then you look at Coder D and see that this coder has the highest minutes per chart of the four coders reviewed today, indicating a 12 percent opportunity for increased use of CAC methods.
You are somewhat alarmed by Coder C and Coder D’s minutes per chart, so you pull up some additional data. You know from experience that more complicated visits typically take longer to code and even though your coders use CAC methods, it doesn’t always mean they are using the fastest or recommended CAC methods. So you look at Coder C first. Here you see that this coder’s average case mix index is higher than the hospital’s average. Whew! The minutes for Coder C now make more sense. However, you also notice that Coder C is using some CAC methods that may not be the best: Coder C spends a lot of time in Document Evidence when they could spend more time in Evidence Review. You make a note to talk to Coder C about workflow and then proceed to look at Coder D. Here you see that this coder’s average case mix index is about the same as the overall hospital. Nothing out of the ordinary with this, but when you dig into specific types of CAC methods, you find similar problems to Coder C. In this case, however, Coder D seems to be doing the majority of their coding in Document Evidence. Additionally, Coder D could increase the overall use of CAC methods as you saw earlier.
After reviewing your CAC system’s measurements, you now have a better idea of how to help increase productivity and use of the system for the coders who may benefit from it.
Of course you could do the same analysis for all of your coders (and you probably will later this afternoon), but you were able to use the data to review the four coders who have some time scheduled with you for direction. Off to work, there’s lots to be done in your hospital’s HIM department, but now you can begin your day with confidence that you have all the pieces of your puzzle: The information you need to help your coders improve.
Clarissa George is a business intelligence specialist at 3M Health Information Systems.


Clarissa George
Business Intelligence Specialist
Clarissa earned her BS in Business Administration with an emphasis in Marketing from Brigham Young University and joined 3M Health Information Systems in 2013. She enjoyed different roles in the…