Inside Angle
From 3M Health Information Systems

Coder Acceptance data: Am I using the correct coding methods?
Today’s data series blog is about analyzing your computer-assisted coding (CAC) data using the Coder Acceptance Method, an exciting topic because Coder Acceptance data will give you a lot of cool insights about how you’re performing! Before I get too far into Coder Acceptance analysis, I want to illustrate how useful and important it can be through a non-coding example.
In our last two data blog posts, Jason used the example of running to explain how to understand data evaluating coding minutes per chart. Let me keep that analogy going as I connect my personal experience with running to Coder Acceptance. I like to run for exercise. I’m not a particularly skilled runner, but I try to keep it up all year and in the summer I train for a half marathon. However, I am susceptible to shin splits in both legs — not from building miles too quickly, but from running incorrectly. My physical therapist discovered that when I run, I use the wrong muscles. Basically, I don’t rely enough on the larger, more capable muscles in my legs such as my calf muscles or hamstrings. I tend to use the front of my shins and other weaker muscles in my legs and feet. My physical therapist works with me to correct my form and build the right muscles so I can run correctly. My “muscle acceptance/use” could therefore be represented graphically for both incorrect and correct form as shown in graph 1.1 below. Note that I don’t know the exact proportion of strength I should be using for the run, but you get the general idea.
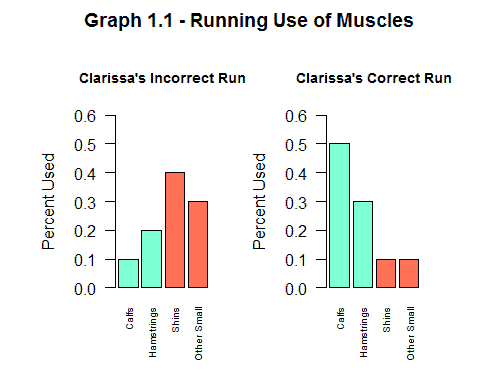 When I run incorrectly, as shown in the graph labeled “Clarissa’s Incorrect Run,” my shins hurt and the run is harder than it needs to be on my body. When I run correctly, as represented in “Clarissa’s Correct Run,” my rate of injury is reduced and I have a better workout as more of my muscles are being used properly.
Even though it felt weird at first to run correctly, I am now more fluid and can maximize the benefits of running and reduce injury. Similarly, using the right Coder Acceptance Methods may feel weird at first, but in the end it will maximize the use and benefits of CAC!
Let me start by giving a few useful definitions to help guide this discussion.
Coder Acceptance Method represents the way a coder accepts final billed codes. Though there are several methods for coder acceptance, we find that customers using 3M CAC software generally use six methods. These are Annotation, CRS, Direct Code, Document Evidence, Codes Pane and Evidence View:
Annotation – Code added by clicking on an annotation.
CRS – Code added from a coding path in 3M’s coding software (3M CRS).
Direct Code – Code added from a direct code entry prompt, dropped in from a Codebook, or dropped in from a reference.
Document Evidence – Auto-suggested code added from evidence in the document view.
Codes Pane – Auto-suggested code accepted from the Codes Pane.
Evidence View – Auto-suggested code added from the evidence view.
In addition to the six main coder acceptance methods, it is also helpful to roll-up all the coding methods into methods that are either CAC based or more manual based. These “roll-ups” allow us to gain an overall picture of coder acceptance method and to gather different kinds of data. The roll-up methods are:
Manual Methods – This includes the methods of annotation, CRS and Direct.
CAC Methods – This method includes every method EXCEPT Annotation, CRS, Direct, Interface (codes accepted through interfaces) and EE (meaning unassigned codes). For the purpose of this blog, I will combine interface and EE into a different bucket called “Other” – this number is usually small and will not affect our analysis.
(Note: Annotations are arguably still somewhat of a CAC method because the coder did code from the highlighted annotation. However, since the engine didn’t necessarily suggest a specific code in this case, we’ll group it with the Manual methods for this discussion.)
As a customer, you can look at your coder acceptance in two different ways: (1) ways the coder accepted all final billed codes or (2) ways the coder accepted only codes that agreed with the CAC suggested codes, which we’ll call “CAC accepted codes.” These are codes where the coder agreed with the engine-suggested code, regardless of whether or not they accepted it using a CAC method or added it using a manual method.
The formulas for these methods are as follows:
Coder Acceptance Method for Final Billed Codes = Coder Acceptance Method Number of Codes / Number of Total Final Billed Codes
Coder Acceptance Method for CAC Accepted Codes = Coder Acceptance Method Number of Codes / Number of Total CAC Accepted Codes.
Now that we have the definitions out of the way, let’s get to work analyzing some data! Our analysis will be broken up into the two ways we can look at coder acceptance as a whole — coder acceptance for CAC accepted codes and coder acceptance for total final billed codes.
Analysis of Coder Acceptance for CAC Accepted Codes
Looking at the data in this setting is helpful because we can see how individuals are coding for codes that the engine already suggested correctly. This can tell us if they are maximizing the use of CAC or if they are using more manual methods or old habits.
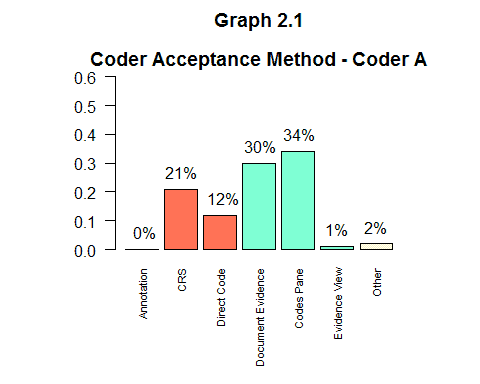 In graph 2.1 we can see that although the coder is using CAC methods, they are using 3M coding software (CRS) and Direct methods more than they have to — all of these codes could have been added using CAC methods. In other words, the Direct and CRS methods used here were not necessary as the engine had already provided the codes.
This kind of analysis can also identify coders who are using the system well, like in graph 2.2.
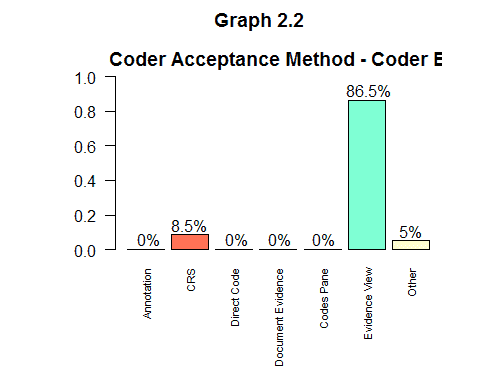 Here we can see that this coder is coding primarily through the recommended workflow of evidence view and only minimally using other methods. Way to go Coder B! That’s what we like to see with Coder Acceptance for CAC accepted codes.
Analysis of Coder Acceptance for Total Final Billed Codes
Unlike Coder Acceptance for CAC accepted codes, this approach makes it easier to see how much improvement is possible when using the correct coding methods at a hospital system or even at an individual coder level. This view of Coder Acceptance is when the rolled up measurements of CAC methods and manual methods become very useful.
Take a look at Hospital System A below in graph 3.1.
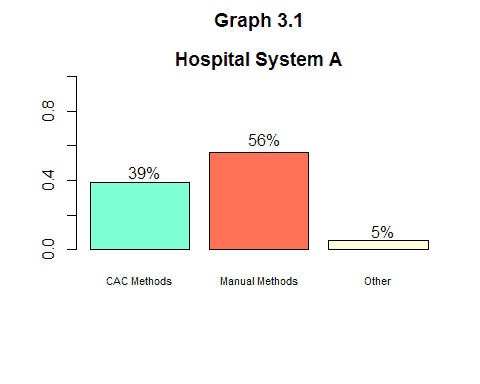 Here we see that the system is using CAC methods 39 percent of the time and manual methods about 56 percent of the time. With CAC methods at 39 percent, it is unlikely Hospital System A is using CAC to the greatest potential. This means that they should have room to reduce manual methods and increase CAC methods. But how much can Hospital System A increase CAC methods? The answer:
Recall – CAC Methods = Opportunity for Increased Use of CAC
Recall will be explained more in depth later in this blog series, but for now know that if you take your enterprise’s recall, subtract your enterprise’s rolled up level of CAC methods, you will have the amount (or percentage) of opportunity for your enterprise to increase the use of CAC methods for your total final billed codes.So let’s add Hospital System A’s aggregate recall to our graph.
 Now if we apply the formula to analyze the opportunity for increased use of CAC, we see that 69% (recall) – 39% (CAC Accepted) = 30% (opportunity for increased use of CAC). This means that for the total final billed codes, 30 percent could be accepted using CAC but are currently being accepted through manual methods. Hospital System A could have almost an additional third of their codes accepted through CAC methods rather than manual methods.
Next, we can look at individual coders at Hospital System A to see who can improve the most and which coders are already maximizing their use of CAC. This allows insight into how much this organization can improve and drill down into the data to see how much each coder can specifically improve. Let’s take a closer look at two coders at Hospital System A, one we will call “asmith16” and the other we will call “abrown16.”
 In Graph 3.3, Hospital System A shows similar similarities between asmith16 and abrown16. Using the same formula as above (Recall – CAC Methods = Opportunity for Increased Use of CAC), we see that each coder has an opportunity to increase their use of CAC.
asmith16: 76% – 59% = 17%
abrown16: 68% – 1% = 67%
We can see that abrown16 has more room to improve than asmith16. This means abrown16 is contributing to the overall hospital system’s opportunity to increase use of CAC more than asmith16. Drilling down in the data like this allows individual systems to assess which coders are already using the CAC system well and which coders have room for improvement and by how much.
Though the correct use of adding codes may take time to learn (just like running), in the long term the new and correct way of using CAC will eventually become muscle memory and you will be able to enjoy the benefits of using CAC to its fullest! Or, when it comes to my running, reducing injury and strengthening the right muscles so I can run without getting hurt and worn out so often.
For more information on how to use coder acceptance method or any of the other performance metrics, come talk with us at the 3M HIS Client Experience Summit! Jason and I will be in the Collaboration Zone!
Clarissa George is a business intelligence specialist at 3M Health Information Systems.


Clarissa George
Business Intelligence Specialist
Clarissa earned her BS in Business Administration with an emphasis in Marketing from Brigham Young University and joined 3M Health Information Systems in 2013. She enjoyed different roles in the…