Inside Angle
From 3M Health Information Systems
AI Talk: Poverty, COVID-19 and satellites
As the pandemic spread in March and April, the nation went into lockdown and the number of cases began to climb, one factor became patently obvious: poor and minority communities were being disproportionately impacted by the virus. What is being done to alleviate this situation? How can tech help? That is the focus of this week’s blog as we launch into summer and society limps back cautiously to a new normal.
SDOH and COVID-19
I came across this article written by the president of the Center for Open Data Enterprise (CODE), Joel Gurin, linking Social Determinants of Health (SDOH) and the relationship to COVID-19. What are social determinants of health? Clinical care and quality of care only contribute to 20 percent of health outcomes. The remaining factors that impact health– where you live, the environmental conditions, water, housing, crime rate, access to transportation, access to nutritional food, community support, etc.—make up social determinants of health.
CODE focuses on collecting and interpreting data from open sources with the goal of furthering social good. They released an excellent round-table report published last December (predates COVID-19, obviously) that focused on SDOH. The report was the result of three forums focused on ways to improve how health data is collected and shared for public benefit. In the foreword, Admiral Giroir, Assistant Secretary for Health in HHS, makes a telling statement: “Truly, in America, your ZIP code is still more important than your genetic code.” What kinds of data are we talking about in the context of SDOH? There is quite a laundry list:
- Department of Labor Unemployment Statistics
- IRS Income tax rates
- Zillow’s walkability and home ownership rates
- Department of Transportation data on proximity to public transportation, proximity to a grocery store, access to food pantry
- EPA data on air quality and toxic waste, data on power plants
- National Parks Service data on parks and recreational areas
- geospatial data and Emergency medical services data
- Department of Education high school dropout rates
- Head Start early childhood enrollment data
- Special Supplemental Nutrition program for Women, Infants and Children (WIC)
- Supplemental Nutritional Assistance Program
The list is endless. The basic point made by this report is there is no dearth of data,; what we are lacking is a strategy to harness it and a way to make the data collection standardized, systematized and useful. All of this data can paint a picture of who is vulnerable and who is at risk for various health conditions. This is happening now in a piecemeal way, but the pandemic underscores the need for action.
An example of data driven insights is being provided by the COVID-19 Healthcare Coalition. They have pulled together data from a variety of sources and have created a dashboard visually showing where vulnerable populations live. Take a look at their data visualization, county by county, across all states. My state, West Virginia, is at the top-end of the scale of vulnerable populations (this is not news to me). Once you have identified who is vulnerable there must be a call to action to address the situation.
AI and Satellites to the rescue
I came across an article in the Science Blog on how satellite images are being used for a novel purpose by Stanford researchers. Using survey data from 43 Demographic and Health Surveys (DHS) from 23 countries, and daytime and night-time satellite image data over period of years, the deep learning algorithm predicts which village is poor and which is rich. DHS surveys are conducted periodically to determine a wide range of data – from child health to education to wealth. This data is converted into an asset index which is then used as ground truths in training the deep learning model. Interesting work. The authors note that it is difficult to interpret what the models are learning. One can intuitively guess the model is picking up clues such as solid structures or hutments, and night images will gauge the level of electrification. This is just speculation on my part. The goal is to identify areas of poverty and areas which could be helped with social services. Again, what actions you choose to take using these insights is really the broader question.
I am always looking for feedback and if you would like me to cover a story, please let me know. “See something, say something!” Leave me a comment below or ask a question on my blogger profile page.
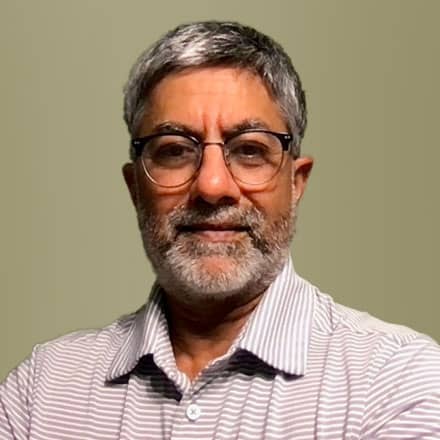
V. “Juggy” Jagannathan, PhD, is Director of Research for 3M M*Modal and is an AI Evangelist with four decades of experience in AI and Computer Science research.


